As a WordPress user, running into occasional issues with your website is inevitable. No code is perfect, and eventually, you might find yourself having to deal with debugging in WordPress.
The good news is that doing so is a relatively quick and straightforward process. There are also several methods you can use to debug WordPress, depending on your experience level.
In this post, we will start by discussing how debugging in WordPress works and how it can help streamline the coding experience. Then we will explain the various debugging tools and features that you can use. Let’s get started!
An introduction to debugging in WordPress
In case you’re unfamiliar, debugging is the process of identifying and resolving errors in your code. It’s an important part of any development project because it helps remove bugs that could cause major issues. Some examples of debugging include:
- Unit tests
- Pair programming
- Code reviews
Debugging in WordPress is best done before taking your project live. You should consider doing it as the final stage of the testing and review process. That way, you can ensure a positive User Experience (UX) and help improve the quality of your code.
Debugging tools and strategies aren’t strictly for developers, either. For example, you can use debugging as a site owner to learn more information about errors that arise on your website.
Let’s say your website suddenly crashes, or you’re faced with the White Screen of Death (WSoD). The issue could very likely be due to a problem with a plugin or theme. For example, a necessary update or a compatibility issue could cause it.
Unfortunately, figuring out the exact source of the error isn’t always straightforward or immediately apparent. You often have to do some troubleshooting, such as deactivating all of your plugins and themes, to help narrow your focus.
This can be a tedious and time-consuming process, especially if many plugins and themes are installed on your website. Fortunately, this is where debugging comes in. Debug mode can notify you of PHP errors and warnings that occur on your site.
3 methods for debugging in WordPress
As we mentioned, there are a handful of ways that you can go about debugging in WordPress. The Content Management System (CMS) comes with a built-in debugging system.
However, there are also a variety of helpful tools and plugins you can use as well. Below are three key tips you can use for handling debugging in WordPress.
1. Activate WP_DEBUG mode manually
One of the quickest and easiest ways to debug in WordPress is to activate the built-in feature. You can do this by editing your site’s wp-config.php file. This log keeps a record of activity on your site and can help you effectively troubleshoot problems that arise.
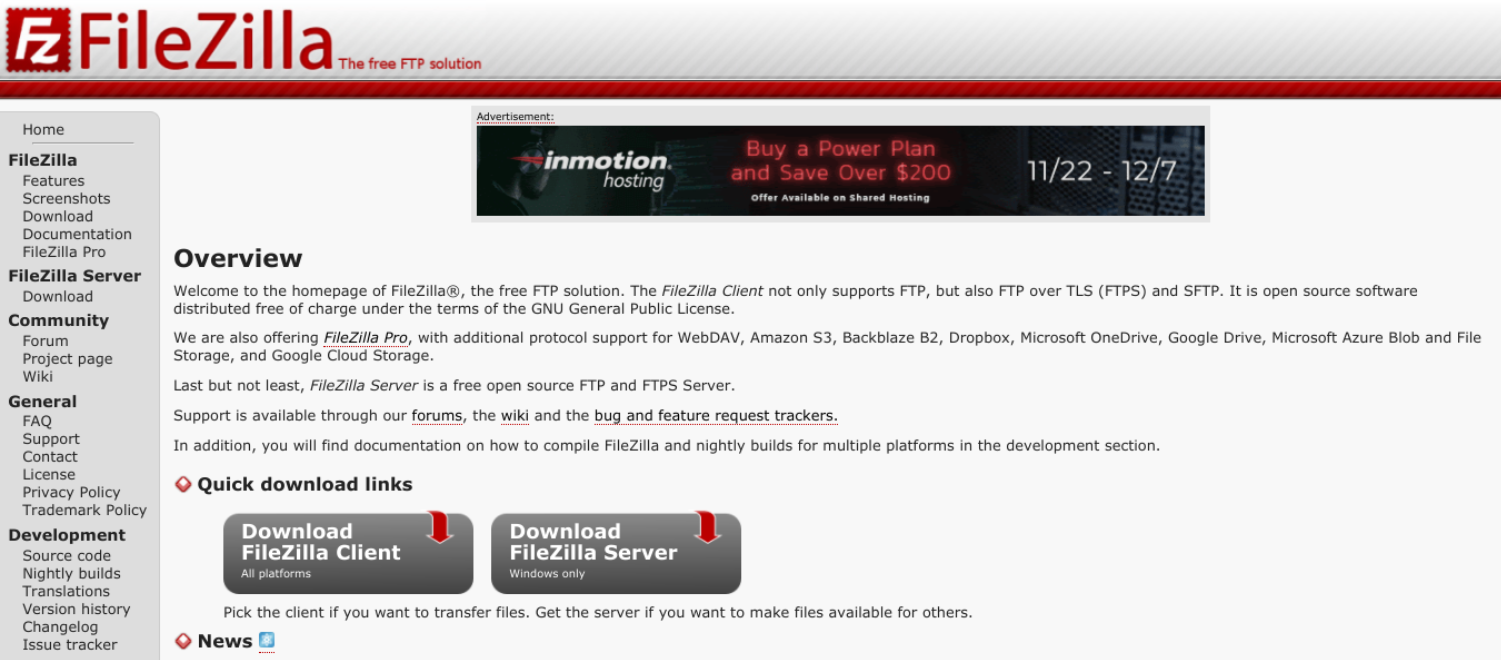
To activate it, you can navigate to the root directory of your website. You can do this either through your hosting provider’s File Manager or by using a File Transfer Protocol (FTP) client such as FileZilla:

The wp-config.php file will be located under public_html:

Once you find and open the file, the next step is to copy and paste the following code snippet:
// Enable WP_DEBUG mode
define( 'WP_DEBUG', true );
// Enable Debug logging to the /wp-content/debug.log file
define( 'WP_DEBUG_LOG', true );
// Disable display of errors and warnings
define( 'WP_DEBUG_DISPLAY', false );
@ini_set( 'display_errors', 0 );
// Use dev versions of core JS and CSS files (only needed if you are modifying these core files)
define( 'SCRIPT_DEBUG', true );
Please note that this should be inserted before the line that reads “/* That’s all, stop editing! Happy blogging. */”. When you’re done, be sure to save your changes.
Also, if for some reason you ever want to deactivate debugging mode, you can do so in the same file. You simply need to change the “true” value to “false”.
2. Access your WP_DEBUG log
In the code featured in the last section, you might notice the line about the WP_DEBUG_log. This is similar to the debug mode. By default, when WP_DEBUG mode is activated, it will display error notices, warnings, and messages in your dashboard.
However, to view a list of such notices, you’ll need to activate the WP_DEBUG_LOG feature, which we just did in the last section. With the feature enabled, now all errors are saved to a debug.log file that you can access from your File Manager or FTP client.
As with wp-config.php, you can find this file under the public_html folder. Note that it may also be inside your wp_content folder.
3. Consider using a debugging plugin
Not every WordPress user is comfortable editing their site’s files, which is totally fine. If you’re a beginner user or would simply rather enable debugging using a plugin, there are a handful of options for you to choose from.
Even if you activate debug mode via your site’s files, there are still some advantages to using debugging plugins. For example, these tools can find more information about bugs and make it easier to monitor your website for PHP issues and errors.
There is a handful of plugins to choose from, but a popular one that we recommend using is Query Monitor:

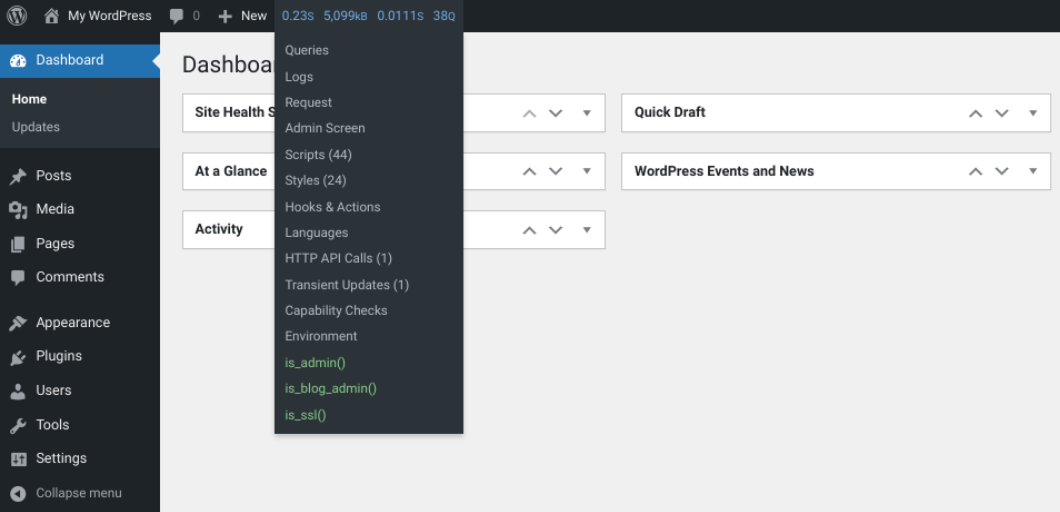
This free tool is an excellent solution for debugging a range of issues in WordPress. It can handle database queries, PHP errors, scripts, stylesheets, and more. It also provides you with a developer panel you can access in your dashboard.
Once you’ve installed and activated the plugin on your site, you can get started by navigating to the menu toolbar along the top:

A lesser-known option you might also consider using is WP Debugging. However, keep in mind that we only recommend working with one third-party debugging tool per site to avoid compatibility issues.
Conclusion
Bugs are bound to happen when building a new website, especially with plugins and themes. Therefore, debugging your code is an important process. However, if you’re new to it, you might be wondering how this process works and how best to go about it.
As we discussed in this post, there are three essential tips you can use for debugging in WordPress:
- Activate WP_DEBUG mode manually by editing your site’s files.
- Access your WP_DEBUG_LOG for a log of saved errors and notices.
- Consider using a debugging plugin such as Query Monitor.
Do you have any questions about debugging in WordPress? Let us know in the comments section below!
Image Credit: Pexels


Recent Comments